CactusTree Layout:
CactusTree is a novel visualization technique for representing the structure and connectivity in deeply nested trees. CactusTree was inspired by our ongoing work in creating biological pathway visualizations that enable a range of different visual analytics tasks. Although biological pathways can be thought of as interconnected graph structures, domain experts tend to carve out particular subgraphs of pathways in order to limit their complexity and to focus on the components that are relevant to a particular research problem. For the most part, the representations of these pathways are hierarchical structures.
An important consideration in visualizing biological pathways is clearly showing how particular biological elements influence or are influenced by other elements. That is, it can be necessary to highlight relevant interconnected sub-trees with a particular directionality, while at the same time making sure not to obscure the hierarchical information in the tree.
CactusTree visualization technique is geared specifically towards more effectively representing overlaid bundles of intersecting links between nodes in the tree. This is a noteworthy approach toward solving the problem of collinearity that was observed in the original paper on hierarchical edge bundling (see Fig. 17 in
Hierarchical Edge Bundling paper). Rather than investigating the bundling techniques themselves, as most existing approaches have attempted, here we have explored the potential of modifying to the underlying tree layout.
Examples:
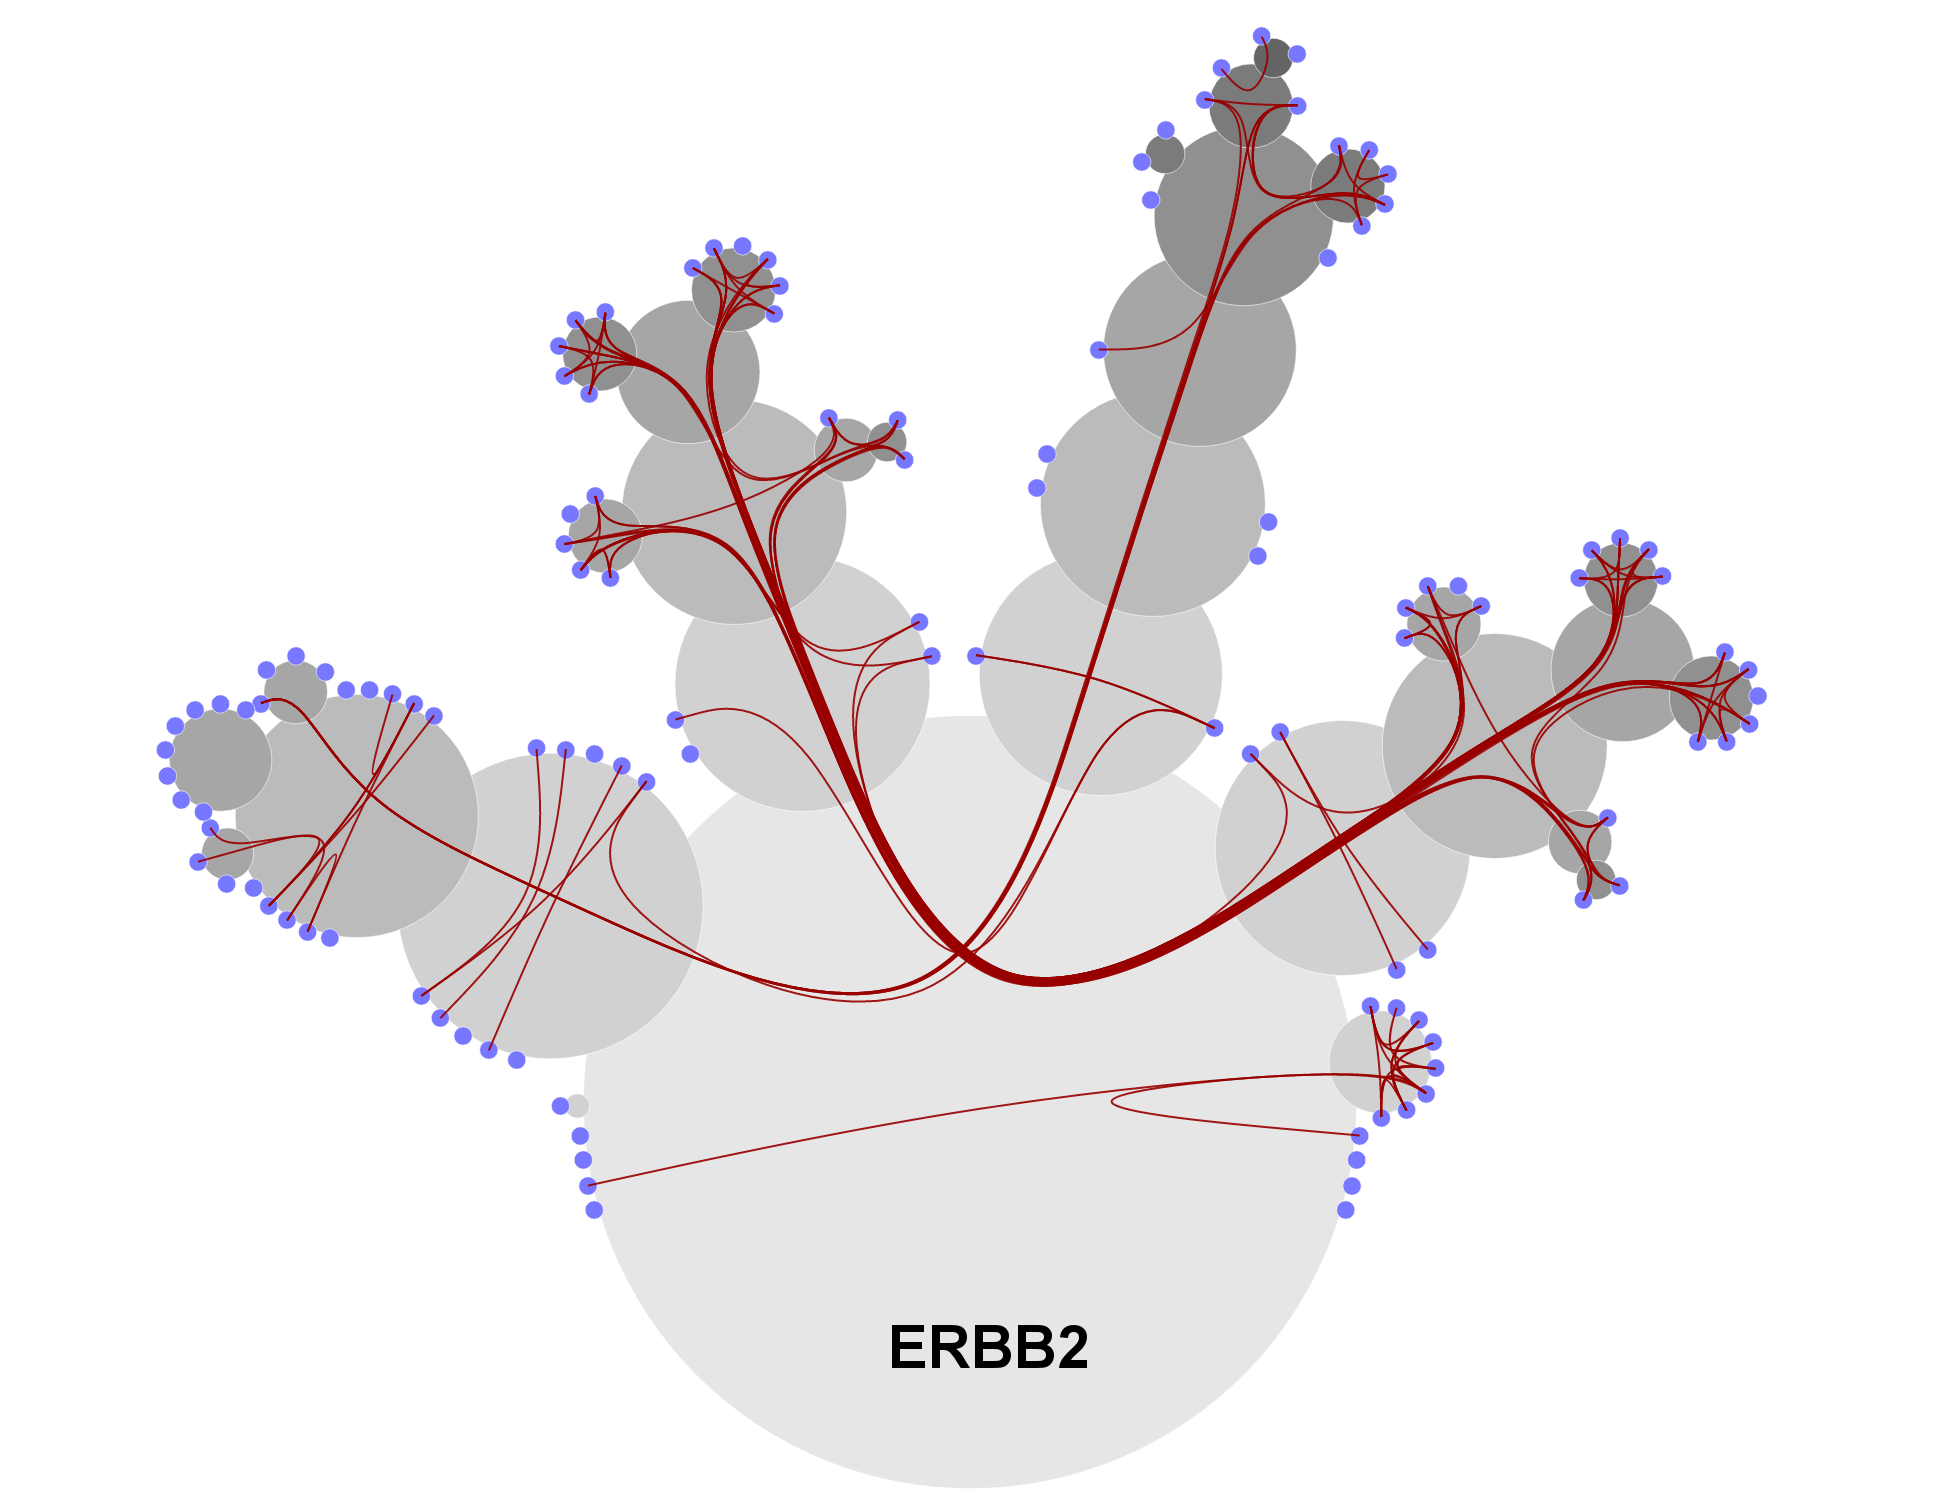
The following figures show CactusTree visualization technique for the Activation of Pro-caspase 8 and ERBB2 pathway. Blue (leaf) nodes are biochemical reactions within this pathway. Gray nodes are sub-pathways which are stacked directly on the top of parent pathway. We use red links to indicate the causal relationships between nodes (biochemical reactions). Connections of nodes in different sub-trees are wired (bundled) through the center of their closest common ancestor.

CactusTree supports Google Maps-like navigation tools, including zooming in/out capability via a mouse scroll as well as navigatingcapability via dragging the mouse. The following figure shows strong causal relationships between 116 biochemical reactions in the NGF Pathway. The right panel shows zooming into a subtree.

CactusTree also supports other interactions, such as collapsing or expanding of node in the hierarchy to simplify or or to fully explore its structure, selecting a connection between two nodes, and highlighting relationships involving an selected item in the hierarchy. The following figure shows carnivora hierarchy, which contains 63 meat-eating species. The data was downloaded from OneZoom and overlaid with the prey-predator data provided by taxonomy experts.
In this figure, we display the images of species within the carnivora food chain. The red links connect predators to their preys. Right panel shows brushing a leaf node under the arrow.

Since child nodes in CactusTree are stacked along the half-arcs of their parent, every parent node has a separated entry for bundled links to its child nodes (the entry is the center of the other half-arc). Consequently, we can visualize interconnectivities between multiple CactusTrees as depicted in the following figure. The data are five biological pathways downloaded from Reactome.
 Multiple CactusTrees can also be interconnected in a circular manner as depicted in the next figure. The data are 20 diseases pathways, such as infectious diseases, diseases of glycosylation, and diseases of metabolism. The red links indicate causal relationships between these pathways.

CactusTree can be used to visualize data from many different domains, such as security and biodiversity. The following figure shows prey-predator relationships between mammals. Carnivora is an evolutionary subtree of the mammal hierarchy. The data is retrived from OneZoom.

© Last revised: Oct 4th, 2016